IMPS-4400
The IMPS-4400 provides the most advanced level of moisture profiling currently available. Using the non-contact Radio Frequency Dielectric Measurement Technology in an arrayed framework allows the IMPS-4400 to deliver the complete picture of your products’ moisture composition.
Moisture Sensor Array
The IMPS-4400 is an Instant Moisture Profiling System (IMPS) that employs an array of 2 inch Radio Frequency Dielectric Sensors used to relate directly to the moisture content of your product. This array can span a wide area allowing up to 128 sensors to measure the true moisture composition of your product.
Moisture Profiling Software
Our proprietary software takes process control to superior levels of productivity. Graphical displays allow a full diagnostic view of moisture profiles that identify issues before they become problems. The IMPS-4400 proprietary software is fully customizable allowing its users to switch graphic paradigms and view their processes from a variety of perspectives.
IMPS-4400 Features
- RF Dielectric Measurement Penetrates Product to Provide True Total Moisture
- Non-Contact Multi-Sensor Moisture Profiling Array
- Easy Communication Between Profiler and HMI System
- Proprietary Software Offering Broad Product Diagnostics
- Data-Logging and Trend Time Plot for Statistical Analysis
- Totally Solid State System
Moisture Profiling Tools
It is equipped with a powerful set of software tools used for comprehensive data logging and statistical analysis that provides a real-time moisture profile of manufacturing lines having multiple-decks and multiple-products. Optionally, the IMPS-4400 comes with an I/O module that provides moisture data outputs to your Plant Master Control Panel.
IMPS-4400 Proprietary Software
Moisture profiling and its diagnostics is a valuable tool for operators and engineers concerned about optimizing their production process. Even beyond the scope of moisture measurement the IMPS-4400 proprietary software can be used to analyze various characteristics of your product or production process. Every production process is unique and applying your knowledge of your process to the IMPS-4400 proprietary software can yield extraordinary discoveries.
Product Density
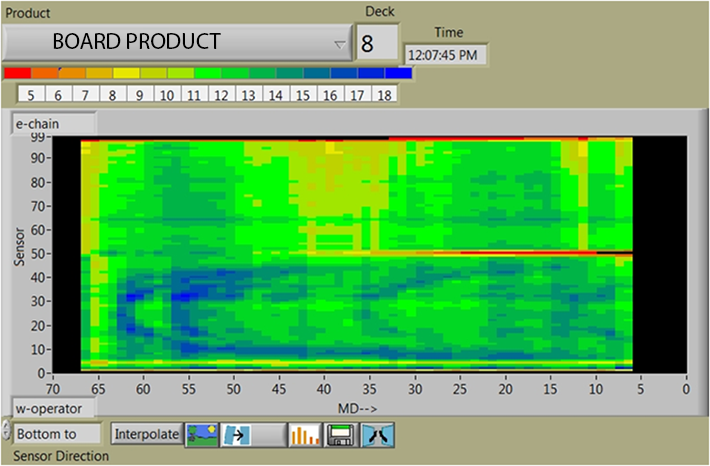
The example shown above illustrates two board products being measured simultaneously just beyond the exit end of the dryer. The board on the top appears to have a slightly over-dried area at its midpoint but the bottom board reveals something completely different.
Plant engineers recognized this graphic as having a higher density in the blue areas as a result of the mixer earlier in the production process. They had taken their knowledge of their process and applied it to what they saw in the IMPS-4400 proprietary software and took corrective action; saving time, reducing product waste, lowering energy costs and improving overall quality.
Multi-Deck Display
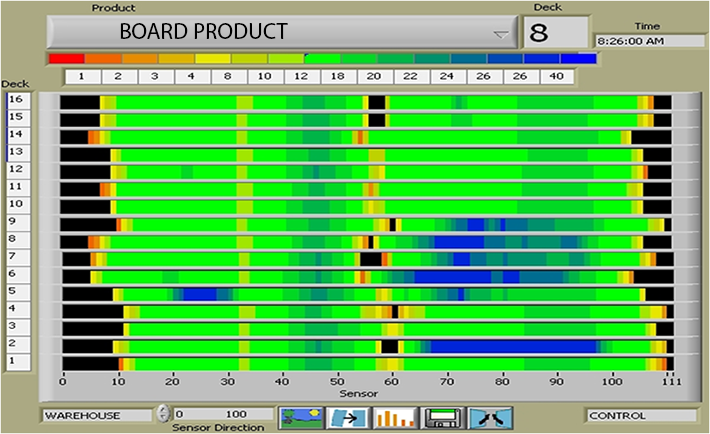
Measuring moisture across several kiln decks can be a daunting task without the assistance of the IMPS-4400. Having a comparison of multiple-decks lined up at the same time yields a valuable tool for your production process. The Multi-Deck Display spotlights correlations of product inconsistency and changes the approach of handling production issues from isolated incidents to comprehensive solutions.
The illustration shown above identifies an issue of inconsistency across a number of decks. Prior to implementing the IMPS-4400 the issue would have gone unnoticed or caused a loss of productivity due to the time taken to draw the correlation clearly shown in the image. Fortunately, the problem had been spotlighted right away and an adjustment to the process control quickly resolved the issue.
Average Moisture Profile
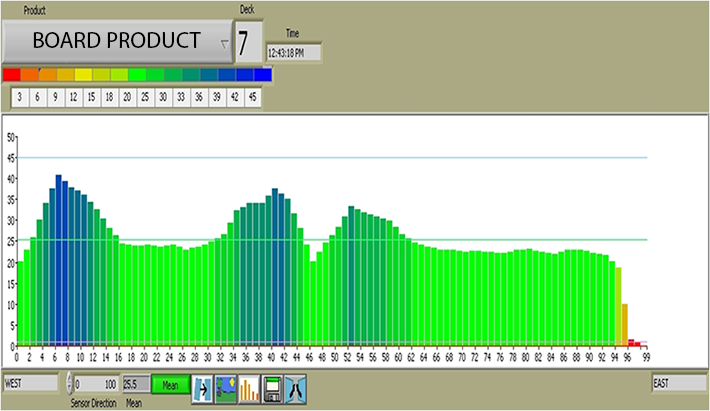
The illustration shown above is another example of two board products being measured simultaneously just beyond the exit end of the dryer. This is another feature of the IMPS-4400 Proprietary Software that provides another perspective of your production process. The bar graph provides a moisture profile of the two board’s width along the horizontal axis giving the average moisture content along the length of each board. The color-coded bars illuminate the moisture profile of each board with the blue representing the damp areas and the yellow and red representing the dryer areas.
From this illustration, plant operators had been able to recognize both boards as having an unusually high moisture profile on the left side of each board with each having a dry core. This high moisture profile had been recognized to be a result of a mixer hydration issue and/or an issue with the water sprayer used for paper fold adhesion on the wet end of the process. Additionally, plant engineers had been able to identify a problem caused by additional heat being released from the chain side of the kiln drying process. The IMPS-4400 Proprietary Software had allowed a number of issues to be identified and corrected without the down-time normally associated with these types of problems.
Moisture Trend Chart
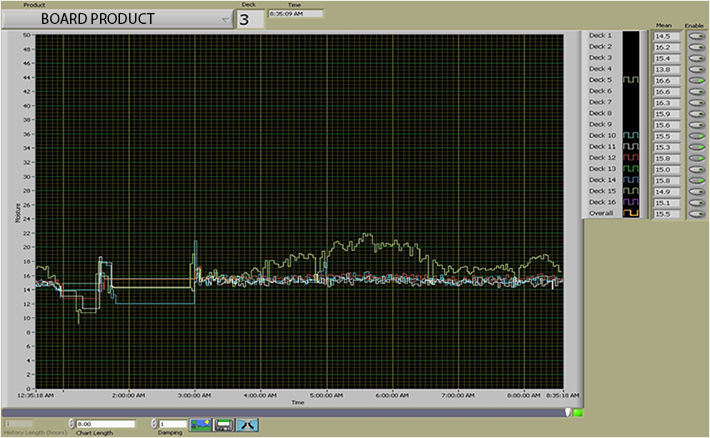
The example above illustrates the moisture trend of each board set measured over time. The moisture trend can be displayed for each individual deck, multiple decks, and the average moisture of all decks for a user defined time period. Time is shown in the horizontal axis and average moisture for a board set is shown on the vertical axis. The most recent board sets measured are shown on the right side of the chart.
In this example, the left side of the trend chart shows a product changeover where the kiln was emptied of product and the last boards out had a low moisture trend. The kiln was empty during the period where the trend is a horizontal line and new product appeared when the trend gapped up on the vertical axis. Note how the moisture trend for one deck started to deviate from the other decks in the middle of the chart indicating an unbalanced drying profile for that particular deck. Plant engineers recognized that this moisture profile was caused by air flow blockage, condensation of water vapor, and under-drying of boards from that deck. The plant engineers took immediate action and corrected the issue as shown in the lower moisture level trend shown in the right side of the chart.
Central Components of the IMPS-4400
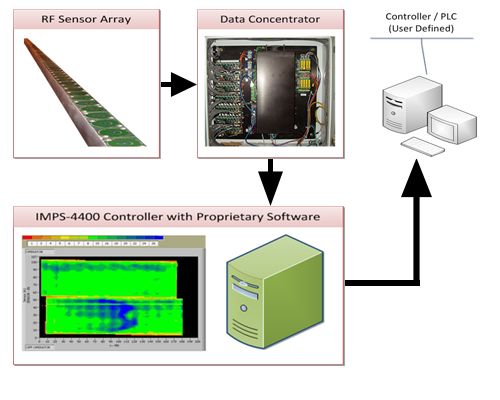
RF Sensor Array
The RF Sensor Array provides the source of the Radio Frequency Dielectric Measurement. Each sensor has a 2” resolution (50mm) and can be combined to cover a 256” (6.5m) width. This array acts as a collective moisture profiling measurement isolating each sensor’s measurement to form a consecutive row of multiple moisture sensors. The IMPS-4400 is not a single moisture sensor but a system containing numerous moisture sensors.
Data Concentrator
The Data Concentrator multiplexes the data received from the RF Sensor Array and combines this high volume of data at a sample rate of 30mS (33 samples per second). Its intelligent design gives the IMPS-4400 the speed to show the true moisture content of your product in real-time.
IMPS-4400 Controller
Perhaps the real power of the IMPS-4400 lies within the IMPS-4400 Controller. Graphical representations of data collected from numerous individual sensors using a Radio Frequency Dielectric Measurement are a powerful combination of technologies. Visualizing moisture profiles from a variety of perspectives with the IMPS-4400 proprietary software takes you from a simple moisture measurement to a better understanding of your production process as a whole.
Controller/PLC (User Defined)
The IMPS-4400 comes with an I/O option that translates data from the IMPS-4400 Controller to an input in your process control system. These inputs include: 4-20mA, 0-10VDC and 0-5VDC.